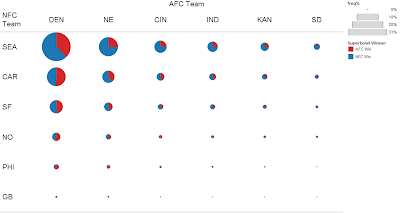
Although RKB fantasy playoff football is on hiatus this year, that doesn't mean we can't still have some fun simulating the potential outcomes. As in other years I have used the Sagarin ratings, assuming the standard deviations of the spreads is 13.89 and the pure points home advantage is 4.2 points. The results are shown below.
As you may have guessed from their performance this year, Denver plays Seattle in the Superbowl 31% of the time. Denver plays somebody 51% of the time, while Seattle plays somebody 58% of the time. It's probably a good idea to have some of those players in a fantasy roster.
The figure below shows the number of games that the teams play, this would be the multiplicative factor on a play chosen to be on a roster.
KAN, SD, PHI and GB play only one game, they lose the first game they play, more than 60% of the time, so you likely won't get much mileage out of those players on your roster.
Finally some alternate views of the Superbowl outcomes. Do these give you a better idea of the relative probabilities?
Colors to tell whether AFC or NFC wins, sorted by winner color.
Colors to tell whether AFC or NFC wins, sorted by AFC.
Colors to tell whether what team wins the Superbowl, sorted by AFC.
Colors to tell whether what team wins the Superbowl, sorted by NFC.
Colors to tell whether what team wins the Superbowl, sorted by SB winner.
Football awaits.


No comments:
Post a Comment